Long-term physical health outcomes of obsessive-compulsive personality disorder traits
Originally published by: Wiley Online Library
Written by: Michael Morreale, Calliope Holingue, Jack Samuels, Gerald Nestadt
Abstract
Background
Obsessive-compulsive personality disorder (OCPD) is characterized by pervasive and persistent traits including preoccupation with orderliness, perfectionism, and control. Relatively little is known about the potential relationship between OCPD traits and physical health.
Methods
We investigated the association between OCPD traits and several self-reported medical conditions in 249 individuals followed prospectively from 1981 until 2004/2005 as part of the Epidemiological Catchment Area.
Results
The OCPD trait score was inversely related to hypertension in males, in models unadjusted (OR = 0.66; 95% CI, 0.45–0.90) and adjusted (OR = 0.70; 95% CI, 0.47–0.95) for sociodemographic variables. Perfectionism was inversely related to hypertension in the unadjusted models for men (OR = 0.34; 95% CI, 0.12–0.89). Indecisiveness was positively associated with heart conditions in adjusted models for women (OR = 3.46; 95% CI, 1.11–10.52).
Conclusion
OCPD traits are associated with cardiovascular health in both sexes. Further studies are needed to understand the specificity of these relationships, as well as to determine the underlying mechanism.
1 INTRODUCTION
According to DSM-5, obsessive-compulsive personality disorder (OCPD) is a disorder characterized by the pervasive and persistent presence of eight distinct traits, including perfectionism, preoccupation with details, excessive devotion to work, excessive conscientiousness, unwillingness to discard useless objects, inability to delegate, miserliness, as well as stubbornness and rigidity(Diedrich & Voderholzer, 2015; Mike et al., 2018; van Broekhoven et al., 2019). OCPD is a clinical construct that requires the presence of at least four of these traits, creating diagnostic flexibility that leads to high patient heterogeneity (Liggett et al., 2018). OCPD is one of the most common personality disorders, affecting between around 2%–8% of the general population, and is found in both males and females equally (Fineberg et al., 2014; Grant et al., 2012; Mike et al., 2018; Riddle et al., 2016; Starcevic & Brakoulias, 2014; van Broekhoven et al., 2019). Despite OCPD's high prevalence and long-term recognition as a personality disorder, it is still heavily under-researched (Diedrich & Voderholzer, 2015; Fineberg et al., 2014; Starcevic & Brakoulias, 2014).
The link between mental disorders and poor physical health outcomes has been well documented (Armenian et al., 1998; Chesney et al., 2014; Eaton et al., 1996; Gross et al., 2010; Krasnova et al., 2019; Lee et al., 2010; Pratt et al., 1996). For example, in several analyses of data from the [East] Baltimore Epidemiological Catchment Area (ECA), depression and personality disorders have been linked to increased risk for cardiovascular and pulmonary health problems (Armenian et al., 1998; Eaton et al., 1996; Gross et al., 2010; Krasnova et al., 2019; Pratt et al., 1996). In comparison, however, relatively little is known about the association between OCPD and physical health. Analysis on data collected as part of the second National Survey of Psychiatric Morbidity found that OCPD, at a diagnostic level as measured by the Structured Clinical Interview for Axis II Personality Disorders (SCID-II), was associated with increased risk of stroke in community-dwelling British adults (Moran et al., 2007). A second analysis of community-dwelling adults in the National Epidemiological Survey on Alcohol and Related Conditions found that OCPD, at a diagnostic level as measured by the Alcohol Use Disorders and Associated Disabilities Interview Schedule IV (AUDADIS-IV), was associated with increased risk for cardiovascular disease and arthritis in adults younger than 55 years old (Quirk et al., 2015).
Several possible mechanisms may link OCPD with subsequent physical disorders. Lifestyle and behavioral factors associated with Cluster C personality disorders, such as tobacco use, may contribute to adverse health effects (Quirk et al., 2015). On a trait level, perfectionism has been shown to predict the presence of compulsive exercise, a maladaptive pattern of behavior that results in increased risk of injury and immune problems (Chamberlain & Grant, 2020; Chesney et al., 2014; Goodwin et al., 2011). More broadly, OCPD personality traits may negatively impact health through a phenomenon termed allostatic load. Allostatic load and its implications have been described in depth elsewhere (McEwen, 1998). Briefly, in response to stressful situations, systems in the body promote adaptation and homeostasis, a process coined “allostasis” (Sterling, 1988). Key systems implicated in this response are the autonomic nervous system, hypothalamic–pituitary–adrenal (HPA) axis, metabolic systems, and the immune system. Allostatic load, sometimes referred to as “wear and tear” on the body and brain, is the result of either chronically underactive or overreactive allostatic systems. The implications of this are profound: chronic underactivity or overactivity can lead to adverse health outcomes (McEwen, 1998). For example, an inadequate endogenous glucocorticoid response (i.e., underactive adaptive system) can lead to autoimmunity (Yehuda, Giller, Southwick, Lowy, & Mason, 1991). Persistently high blood pressure and glucocorticoid levels (i.e., overactive adaptive system) can promote obesity and Type 2 diabetes (Lundberg et al., 1989). Critically, too much chronic stress causes these systems to exhaust or “wear,” leading to underactivity or overactivity of these allostatic systems, i.e., allostatic load, and subsequent “tear” on the body (McEwen, 1998).
For individuals struggling to manage OCPD personality traits, increased allostatic load could manifest as a result of multiple reasons, including from life-style or behavioral patterns (such as smoking or problematic exercise) as well as from heightened chronic psychosocial stress associated with the maladaptive over-emphasis of the traits (Chamberlain & Grant, 2020; Chesney et al., 2014; Christman, 2012; Goodwin et al., 2011; Quirk et al., 2015). Either domain (maladaptive behavior or chronic exposure to stress) could lead to an accelerated rate of allostatic load accumulation over time in individuals with OCPD, similar to what has been observed with other mental health conditions, such as mood disorders (McEwen, 2003). In fact, the allostatic load associated with mood disorders has been tied to several subsequent health problems, including cardiovascular health and bone density (McEwen, 2003). In the broader public health literature, allostatic load has been associated with numerous poor health outcomes. In terms of the cardiovascular system, high blood pressure (Mattei et al., 2010; McEwen, 1998; Seeman et al., 1997), stroke (Mattei et al., 2010; McEwen, 1998; Seeman et al., 1997), myocardial infarction (Mattei et al., 2010; McEwen, 1998; Seeman et al., 1997), as well as cardiovascular and heart disease (Guidi et al., 2021; Mattei et al., 2010) have all been associated with allostatic load. Similarly, allostatic load has been linked to metabolic diseases such as diabetes (Mattei et al., 2010; McEwen, 1998; Seeman et al., 1997), immune conditions including arthritis/rheumatism (Guidi et al., 2021; Mattei et al., 2010), asthma (Bahreinian et al., 2013), and even multi-system diseases like cancer (Akinyemiju et al., 2020).
Despite these proposed mechanisms, little is known about the association between OCPD and long-term physical health, especially when compared to other mental disorders and other personality disorders. In addition, it is unclear how the individual traits associated with OCPD can affect long-term physical health. Using data collected from the Epidemiologic Catchment Area Study (ECA), we investigate if the presence of one or more of the clinical traits of OCPD, namely, emotional constraint, excessive work devotion, perfectionism, stubbornness, and indecision, results in increased rates of poor health outcomes later in life.
2 METHODS
2.1 Data collection
Data for this analysis were collected in Baltimore, Maryland as part of the Epidemiologic Catchment Area (ECA) Study and ECA Follow-up Study (Eaton, 1981). The ECA is a population-based, longitudinal cohort study that followed the physical and mental health of individuals starting with Wave 1 (1981), and continued to the most recently completed Wave 4 (2004–2005; Dong et al., 2018). The samples from the ECA have been described in detail previously (Dong et al., 2018; Nestadt et al., 1992). In brief, of the 3481 participants interviewed by nonclinician interviewers at Wave 1, 1086 were selected for a psychiatric clinical reappraisal (CR). Of these, 810 received an examination by psychiatrists in 1981–1982 to evaluate the presence of Axis I and Axis II diagnoses based on DSM-III criteria (Lee et al., 2010). Of these participants, 249 were again interviewed as part of the ECA follow-up by nonclinicians at Wave 4 in 2004/2005.
2.2 Measures
Sociodemographic information was recorded for each of the participants at Wave 1, including age, race, sex, marital status, education, and history of tobacco use (Lee et al., 2010). The self-reported medical history of each participant was also collected at both Wave 1 and Wave 4 by trained nonclinical interviewers (Lee et al., 2010). This medical history includes myocardial infarction, high blood pressure, arthritis/rheumatism, cancer, asthma, osteoporosis, stroke, diabetes, and heart conditions (a collective categorization). Heart conditions includes rheumatic heart disease, angina pectoris, and congestive heart failure. While these are not the complete list of health conditions collected at Wave 1, they were chosen due to their association with allostatic load, as described in Section 1. For this analysis, Wave 1 captured baseline health history for both physical and mental conditions (Armenian et al., 1998; Chesney et al., 2014; Eaton et al., 1996; Gross et al., 2010; Krasnova et al., 2019; Lee et al., 2010; Moran et al., 2007; Pratt et al., 1996). Medical conditions reported at Wave 4 were used as dependent variables. Each of the self-reported medical conditions was recorded at Wave 4 as a dichotomous outcome (ever present vs. never present).
The psychiatric clinical reappraisal (CR) of the 810 individuals following Wave 1 was used to establish the presence (clinical or subclinical) of the five DSM-III OCPD traits, including emotional constraint, perfectionism, stubbornness, excessive work devotion, and indecisiveness. The methodology of the Clinical Reappraisal team has been published in detail (Nestadt et al., 1992). To summarize, each trait was rated by the psychiatrists on a scale from 0 to 3: (0) not present, (1) subclinical, probably no distress, (2) clinically present, probable distress in major life events, (3) clinically present in minor life events. For analyses of individual traits, each was dichotomized as “not present” (score of 0) or “present” (scores 1–3). A summary score (OCPD trait score) was also calculated for each participant, which represented the sum of scores across all of the five traits. This score was derived before dichotomization of the individual traits; the possible range of scores spanning from 0 to 15 (Nestadt et al., 1991). Lastly, as a sensitivity analysis, a binary variable was used to differentiate between people with at least one clinically present trait (the individual received at least one score of “2” or “3”) and those with no clinically present traits (the individual received a score of “0” or “1” for all five traits). Individuals with a value of “uncertain” or “not applicable” were classified as missing.
2.3 Statistical analysis
Three different sets of logistic regression models were fit to estimate the unadjusted and adjusted associations between OCPD traits at Wave 1 in 1981 and each lifetime medical condition at Wave 4 in 2004/2005. Model 1 assesses the unadjusted associations between each OCPD trait and lifetime prevalence of the medical condition at Wave 4. Model 2 assesses the associations between each OCPD trait and lifetime prevalence of the medical condition at Wave 4, adjusting for Wave 1 sociodemographic variables (age, sex, race, marital status, education, and smoking status). Model 3 assesses the associations between each OCPD trait and lifetime prevalence of the medical condition, adjusting for the sociodemographic factors in Model 2 as well as the presence of the medical condition at Wave 1.
3 RESULTS
3.1 Baseline characteristics
The baseline characteristics of the 249 participants who completed the Wave 4 Follow-Up are presented in Table 1. Most participants were female (69%) and white (60%). At baseline, the majority had received a high school education or lower (69%), and most were between the ages of 18 and 64 (mean 47; SD 17.74). The largest number of people were married or cohabiting with a partner (39%), with the remaining participants previously partnered (30%) or single (31%). Most participants (84% of males, 78% of females) reported a history of smoking tobacco (cigarettes, cigars, or pipes) at some point during their lifetime.
Table 1. Participant sociodemographic characteristics at Wave 1 clinical reappraisal

Note: Sociodemographic characteristics at time of evaluation for the 249 individuals who completed both the Clinical Reappraisal (1981) and Wave 4 Evaluation (2004–2005) during the Epidemiological Catchment Area study.
3.2 Prevalence of OCPD traits and distribution of OCPD trait scores
Prevalence of individual OCPD traits for those who completed the Wave 4 follow-up were found to range between 34% (perfectionism) and 12% (indecisiveness; Table S1). Only four participants were found to meet the DSM-III diagnostic criteria for OCPD (data not shown). In regard to the OCPD trait score (which is the sum of all five nondichotomized traits), 39% of participants who completed Wave 4 were found to have no OCPD traits present, while 61% were found to have at least one trait present. Out of a total possible score of 15, the range was 0–12, with a mean of 1.5, and a median of 1. Most participants (75%) scored lower than a 3.
3.3 Lifetime prevalence of medical conditions
The most common conditions reported in both males and females who completed the Wave 4 Follow-up were high blood pressure (males: 44%; females: 56%) and arthritis (males: 39%; females: 59%; Table S2). Myocardial infarction was not included in further analyses due to not being included in the Wave 1 interview. Cancer, asthma, osteoporosis, and stroke were considered rare events (fewer than 10 individuals of either sex reported these health conditions at Wave 4) and were also not included in further analysis.
3.4 Relationship between OCPD traits and high blood pressure
The OCPD trait score at Clinical Reappraisal was inversely related to the presence of high blood pressure in men both in the unadjusted Model 1 (OR = 0.66; 95% CI, 0.45–0.90) and Model 2, which adjusted for sociodemographic variables (OR = 0.70; 95% CI, 0.47–0.95) (Table 2). Perfectionism also was inversely related to high blood pressure in the unadjusted Model 1 (OR = 0.34; 95% CI, 0.12–0.89) for men. However, this association was no longer significant after adjusting for baseline health and sociodemographic factors. No significant associations were observed between OCPD traits and high blood pressure in women (Table 3).
Table 2. Logistic regression models estimating odds of high blood pressure in males at Wave 4, given OCPD trait presence found at clinical reappraisal
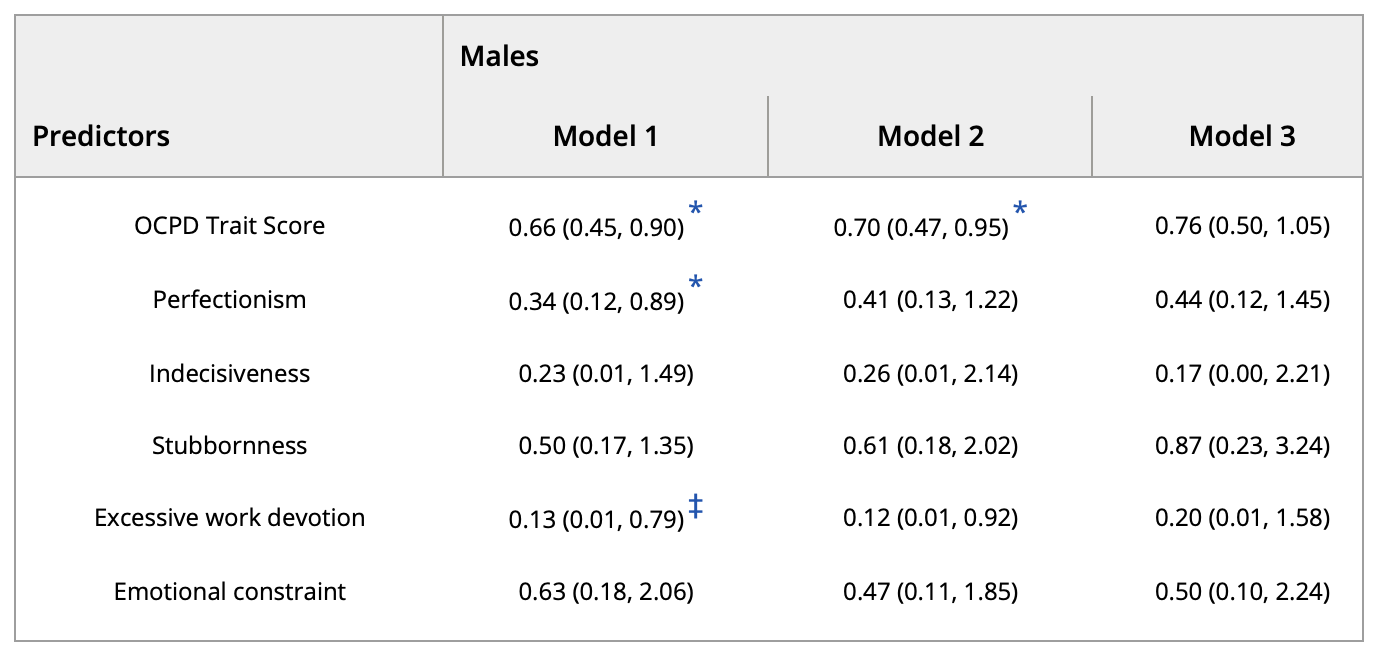
Note: Odds ratio for individuals to be observed with the physical health outcome of high blood pressure associated with exposure to individual OCPD traits as well as the OCPD Trait Score for males. Model 1 represents unadjusted odds ratios for each trait. Model 2 represents odds ratios adjusted for the sociodemographic variables of age, race, marital status, lifetime smoking, and education at Wave 1. Model 3 represents odds ratios adjusted for the above sociodemographic variables as well as presence of high blood pressure at Wave 1. Excluding OCPD Trait Score, all trait associations are investigated independently of each other.
* Significant at p ≤ .05.
‡ Significant at p ≤ .1.
Table 3. Logistic regression models estimating odds of high blood pressure in females at Wave 4, given OCPD trait presence found at clinical reappraisal

Note: Odds ratio for individuals to be observed with the physical health outcome of high blood pressure associated with exposure to individual OCPD traits as well as the OCPD Trait Score for females. Model 1 represents unadjusted odds ratios for each trait. Model 2 represents odds ratios adjusted for the sociodemographic variables of age, race, marital status, lifetime smoking, and education at Wave 1. Model 3 represents odds ratios adjusted for the above sociodemographic variables as well as presence of high blood pressure at Wave 1. Excluding OCPD Trait Score, all trait associations are investigated independently of each other.
To assess whether the association observed between the OCPD trait score and high blood pressure among males was a result of clinically significant OCPD personality traits or subclinical traits present among the general population (e.g., conscientiousness), we carried out a sensitivity analysis, in which the predictor was now a binary variable representing whether or not the participant had any clinically significant OCPD traits. The results from this sensitivity analysis paralleled what was observed with the OCPD trait score variable; individuals with at least 1 clinically significant trait were less likely to have high blood pressure in both Model 1 (OR, 0.18; 95% CI, 0.03–0.75) and Model 2 (OR, 0.13; 95% CI, 0.02–0.66), but not Model 3 (OR, 0.2; 95% CI, 0.02–1.10).
3.5 Relationship between OCPD traits and heart trouble
The indecisiveness trait in females was found to be significantly associated with heart conditions in Model 2 (OR = 3.46; 95% CI, 1.11-10.52), which adjusted for sociodemographic variables, as well as in Model 3 (OR = 3.60; 95% CI, 1.12–11.17), which adjusted for both sociodemographic variables and baseline presence of heart conditions (Table 4). No significant associations were observed between OCPD trait exposure and heart conditions in males (Table 5).
Table 4. Logistic regression models estimating odds of heart conditions in females at Wave 4, given OCPD trait presence found at clinical reappraisal

Note: Odds ratio for individuals to be observed with the physical health outcome of heart conditions associated with exposure to individual OCPD traits as well as the OCPD Trait Score for females. Model 1 represents unadjusted odds ratios. Model 2 represents odds ratios adjusted for the sociodemographic variables of age, race, marital status, lifetime smoking, and education at Wave 1. Model 3 represents odds ratios adjusted for the above sociodemographic variables as well as presence of heart conditions at Wave 1. Excluding OCPD Trait Score, all trait associations are investigated independently of each other.
‡ Significant at p ≤ 0.1.
* Significant at p ≤ .05.
Table 5. Logistic regression models estimating odds of heart conditions in males at Wave 4, given OCPD trait presence found at clinical reappraisal
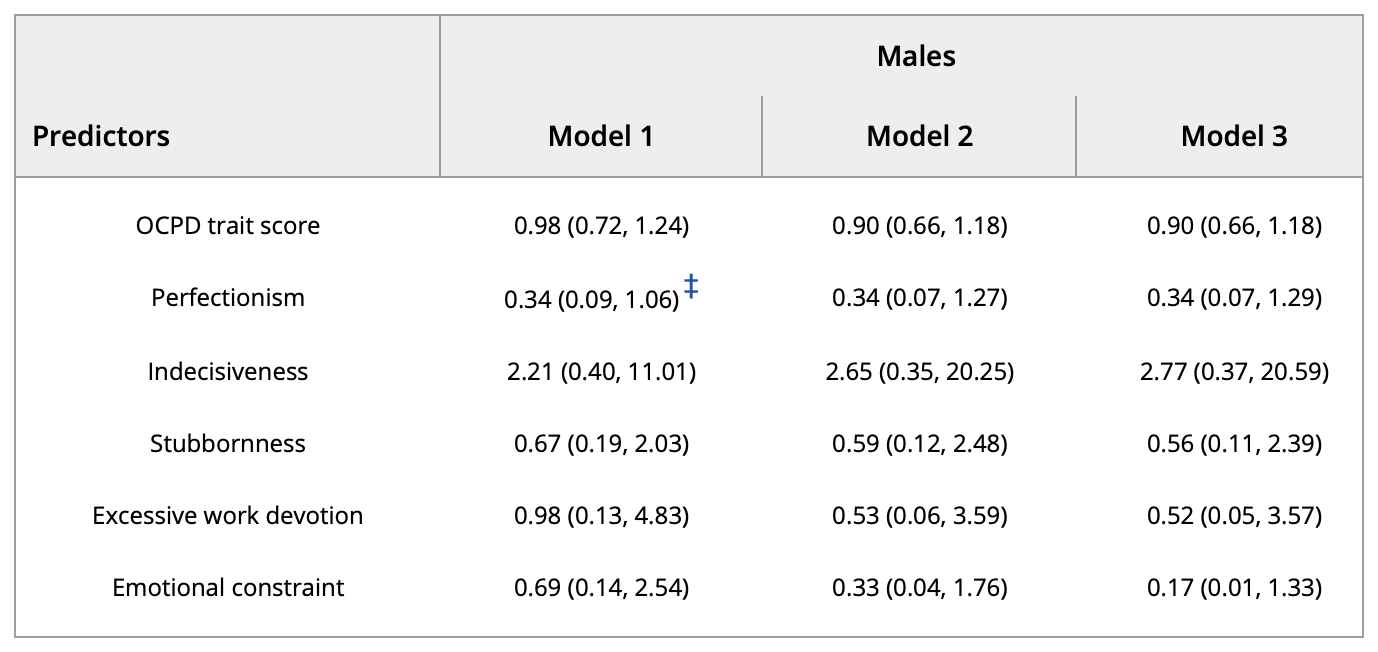
Note: Odds ratio for individuals to be observed with the physical health outcome of heart conditions associated with exposure to individual OCPD traits as well as the OCPD Trait Score for males. Model 1 represents unadjusted odds ratios. Model 2 represents odds ratios adjusted for the sociodemographic variables of age, race, marital status, lifetime smoking, and education at Wave 1. Model 3 represents odds ratios adjusted for the above sociodemographic variables as well as presence of heart conditions at Wave 1. Excluding OCPD Trait Score, all trait associations are investigated independently of each other.
‡ Significant at p ≤ 0.1.
3.6 Relationship between OCPD traits score and other medical conditions
No significant associations were found in either sex between the presence of OCPD traits and arthritis (Tables S3 and S4) or high blood sugar/diabetes (Tables S5 and S6).
4 DISCUSSION
In this study, we investigated the prospective associations between OCPD traits and self-reported medical conditions in a community cohort. OCPD trait presence, sociodemographic status, and baseline physical health were measured in Wave 1/Clinical Reappraisal (1981–1982), while medical conditions were measured at Wave 4 (2004–2005). The physical health outcomes that were analyzed were not all-encompassing. They were selected by the authors based on their inherent ability to result from long work hours, increased allostatic load, and had been previously associated with exposure to mental disorders, including both OCPD as well as disorders with which OCPD has high co-morbidity rates (Armenian et al., 1998; Chesney et al., 2014; Eaton et al., 1996; Gross et al., 2010; Krasnova et al., 2019; Lee et al., 2010; Moran et al., 2007; Pratt et al., 1996).
A few prior studies have found that OCPD is associated with cardiovascular disease and stroke (Moran et al., 2007; Quirk et al., 2015). While the lifetime prevalence of stroke in our sample at Wave 4 was too small for further analysis, we found a positive association between indecisiveness and heart conditions (rheumatic heart disease, angina pectoris, or congestive heart failure) in females. This association could also be a result of the higher levels of smoking seen in individuals with Cluster C personality disorders, which could, in turn, lead to higher rates of heart problems (Quirk et al., 2015). While our analysis did control for smoking, it assessed only a binary variable of lifetime ever smoking; recency of smoking and level of consumption were not adjusted for.
We found that among males, a higher OCPD trait score was negatively associated with high blood pressure in both the unadjusted and adjusted models. While all five traits demonstrated an inverse association with high blood pressure, perfectionism was the only trait that reached significance in the unadjusted Model 1. These findings are in contrast to previous studies. OCPD and Cluster C personality disorders, in general, have been associated with risk of stroke and cardiovascular disease, both of which can result from high blood pressure (Moran et al., 2007; Quirk et al., 2015). There are several possible reasons for this discrepancy. The first is inter-trait heterogeneity. OCPD is a collection of various traits, and there is potential for differences in which particular traits are more emphasized between study populations (Mike et al., 2018; Nestadt et al., 1992; van Broekhoven et al., 2019). As previous research has focused on OCPD as a single construct, it is impossible to compare individual trait prevalence across cohorts (Moran et al., 2007; Quirk et al., 2015).
For our analysis, while it is possible that the association between the OCPD trait score and high blood pressure is being driven by particular traits, namely perfectionism and excessive work devotion, the associations between the other three personality traits and high blood pressure are also negative, despite not being statistically significant. Therefore, it seems most plausible that the significant association observed between the OCPD trait score and high blood pressure is likely the result of multiple traits.
A second potential explanation for this discrepancy is intra-trait heterogeneity, both in terms of intensity (subclinical vs. clinical) and manifestation (phenotype). The OCPD trait score, as a summation of all trait scores, also opens itself to heterogeneous individuals being equivalent in our models. For example, a trait score of 3 could either be a single trait present with clinical distress, or it could be three traits present at a subclinical level (based on the scoring model described in Section 2, 2). To assess whether the association observed among men between the OCPD trait score and high blood pressure was a result of clinically relevant traits or subclinical traits, we performed a sensitivity analysis to look at the association between the presence of at least one clinically significant OCPD trait and high blood pressure. The inference from this sensitivity analysis was similar, suggesting that the presence of these clinically significant traits may be driving this relationship. However, due to our relatively small sample size, we were not able to investigate this for each individual personality trait.
Intra-trait heterogeneity in terms of behavioral manifestation could also account for the discrepancy between past research and our results. While trait stability is characteristic of personality disorders, the traits themselves can manifest in heterogeneous phenotypes across individuals (Diedrich & Voderholzer, 2015; Goodwin et al., 2011; Liggett et al., 2018). As an example, Goodwin et al. (2011) highlight the nuances between intra-trait differences in perfectionism. These authors found that while self-perfectionism was associated with higher rates of compulsive exercising for both boys and girls, social-perfectionism was associated with compulsive exercising only for boys. Perfectionism may manifest itself not only in harmful behaviors (such as detrimental over-exertion or stress) but in protective behaviors (greater health care utilization and physiological management, leading to better long-term health). In fact, Fineberg et al. (2014) noted that previous research has found that those with OCPD are more likely to utilize primary healthcare and have suggested that OCPD can be beneficial, specifically in action-reward scenarios. In parallel with how perfectionism can manifest in both protective and harmful ways, a final explanation for the discrepancy between our results and those of previous research is the difference in time between assessment of trait presence and assessment of physical health outcomes. The studies cited above are either cross-sectional (0 years difference) or have a follow-up period of 2–4 years (Moran et al., 2007; Quirk et al., 2015). For our cohort, 20 years passed between trait assessment (1981) to physical health reporting (2004–2005). It is possible that with so much time elapsing, the men who were captured in Wave 4 had more protective behavioral manifestations of their OCPD traits (irrespective of trait severity), while the men with harmful trait manifestations either died or were lost to follow-up. Further research will be required to investigate how to categorize subtypes of OPCD traits, as well as how those subtypes interact with the environment, contribute to behavioral patterns, and affect physical health.
There are several strengths of this study. The data used were collected as part of the longitudinal ECA study (Dong et al., 2018). While symptomatology was originally detected via a semi-structured nonclinical interview, personality disorder diagnosis and clinical symptomatology were established by a follow-up psychiatric exam (Clinical Reappraisal; Dong et al., 2018; Nestadt et al., 1992). To the best of our knowledge, there are no other epidemiological studies utilizing clinician-administered psychiatric exams to assess OCPD. Furthermore, very few studies have evaluated personality disorders in the general (nonclinical) population on the level of individual traits.
There are also several limitations to this manuscript. First, our sample size is relatively small, as only 249 of the original 810 Clinical Reappraisal participants completed Wave 4. Therefore, we may be underpowered to detect significant associations between OCPD traits and medical conditions if they do exist. The goal of using Wave 4 to investigate physical health outcomes was to allow maximal time for these pathologies to develop; however, there was high attrition over the long follow-up period. Additionally, there is the possibility for selection bias due to drop out, given that only 31% of the Clinical Reappraisal participants took part in Wave 4. Another limitation was the reliance on DSM-III criteria for diagnosis of both the mental disorders that lead to being assigned for clinical re-evaluation, as well as for the diagnosis of OCPD. However, many of the OCPD traits that were used in the DSM-III continue to be used in the DSM-V, so the diagnostic criteria are still relevant (Diedrich & Voderholzer, 2015; Mike et al., 2018; van Broekhoven et al., 2019). Analyzing the individual traits rather than a diagnosis of OCPD further minimalizes this limitation. Finally, due to sample size and limited variability, we did not adjust for mental health diagnoses at baseline, implying our findings may be confounded.
Future research should evaluate the associations between OCPD traits and subclinical or prodromal stages of the medical conditions used in this study, particularly if biomarker data are available. In addition, research should include study populations with more variability in OCPD traits. This would allow for distinction between different manifestations of the traits (subclinical, clinical, and clinical with distress). Finally, future research should investigate the association between OCPD traits and other mental disorders, and how these disorders might confound or moderate the association between OCPD traits and physical health.
To the best of our knowledge, this is the first report on the long-term prospective association between specific OCPD traits and medical conditions in a community sample. The findings suggest the need to further understand the mechanism of these associations, which may help us understand how personality and development of medical conditions are linked.
ACKNOWLEDGEMENTS
Special thanks to Dr. William Eaton and the Johns Hopkins Epidemiologic Catchment Area (ECA) for allowing us to use this data. Calliope Holingue was supported by the T32 Psychiatric Epidemiology Training Program (5T32MH014592-43; PI Zandi).
References available in original article on Wiley Online Library.